Thermal Imaging

Detect Faults Before They Become Outages
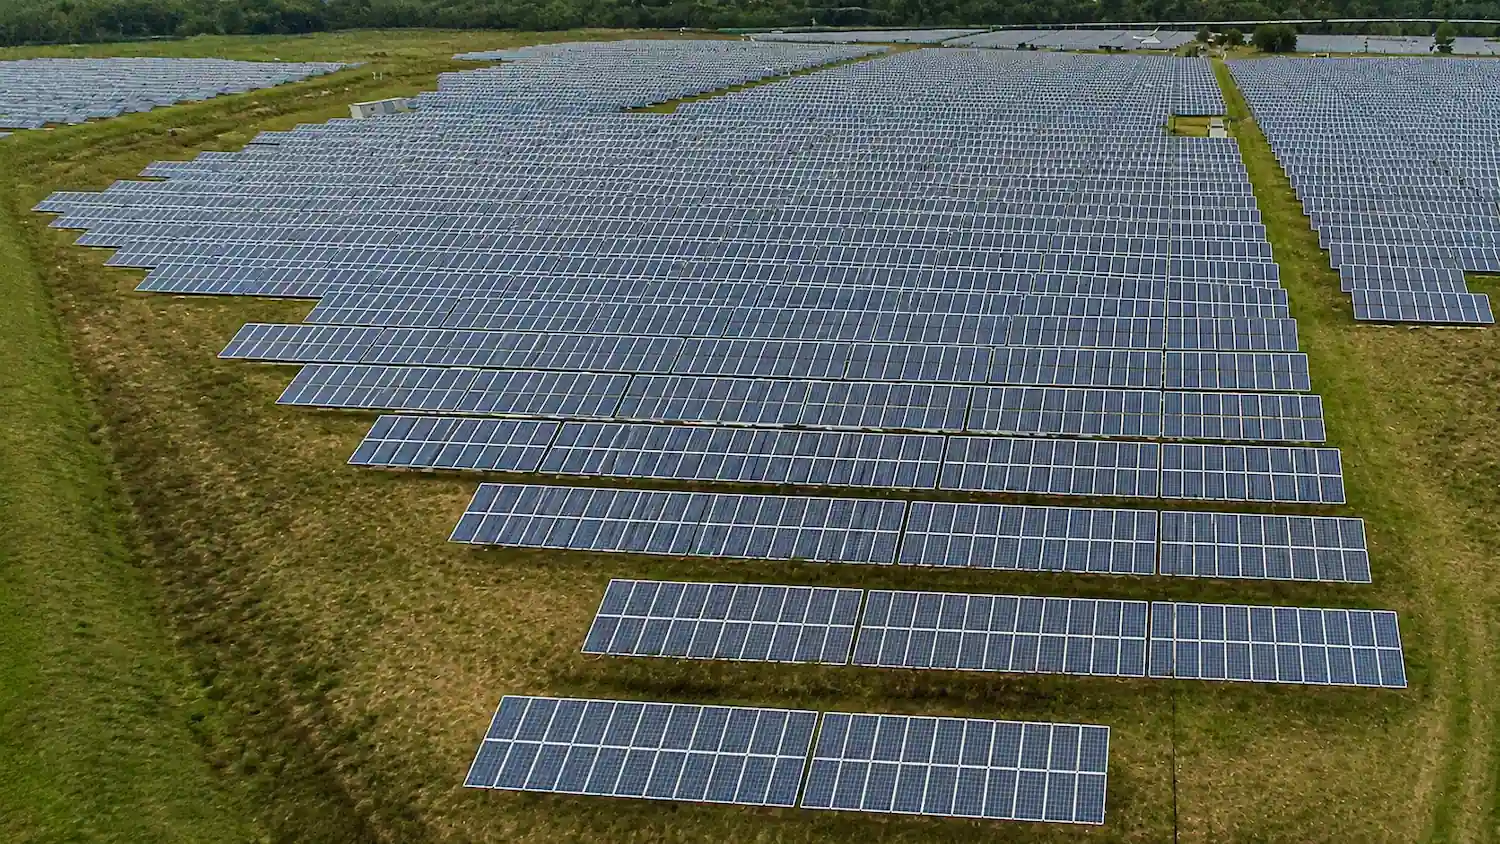
Visual daylight view of asset
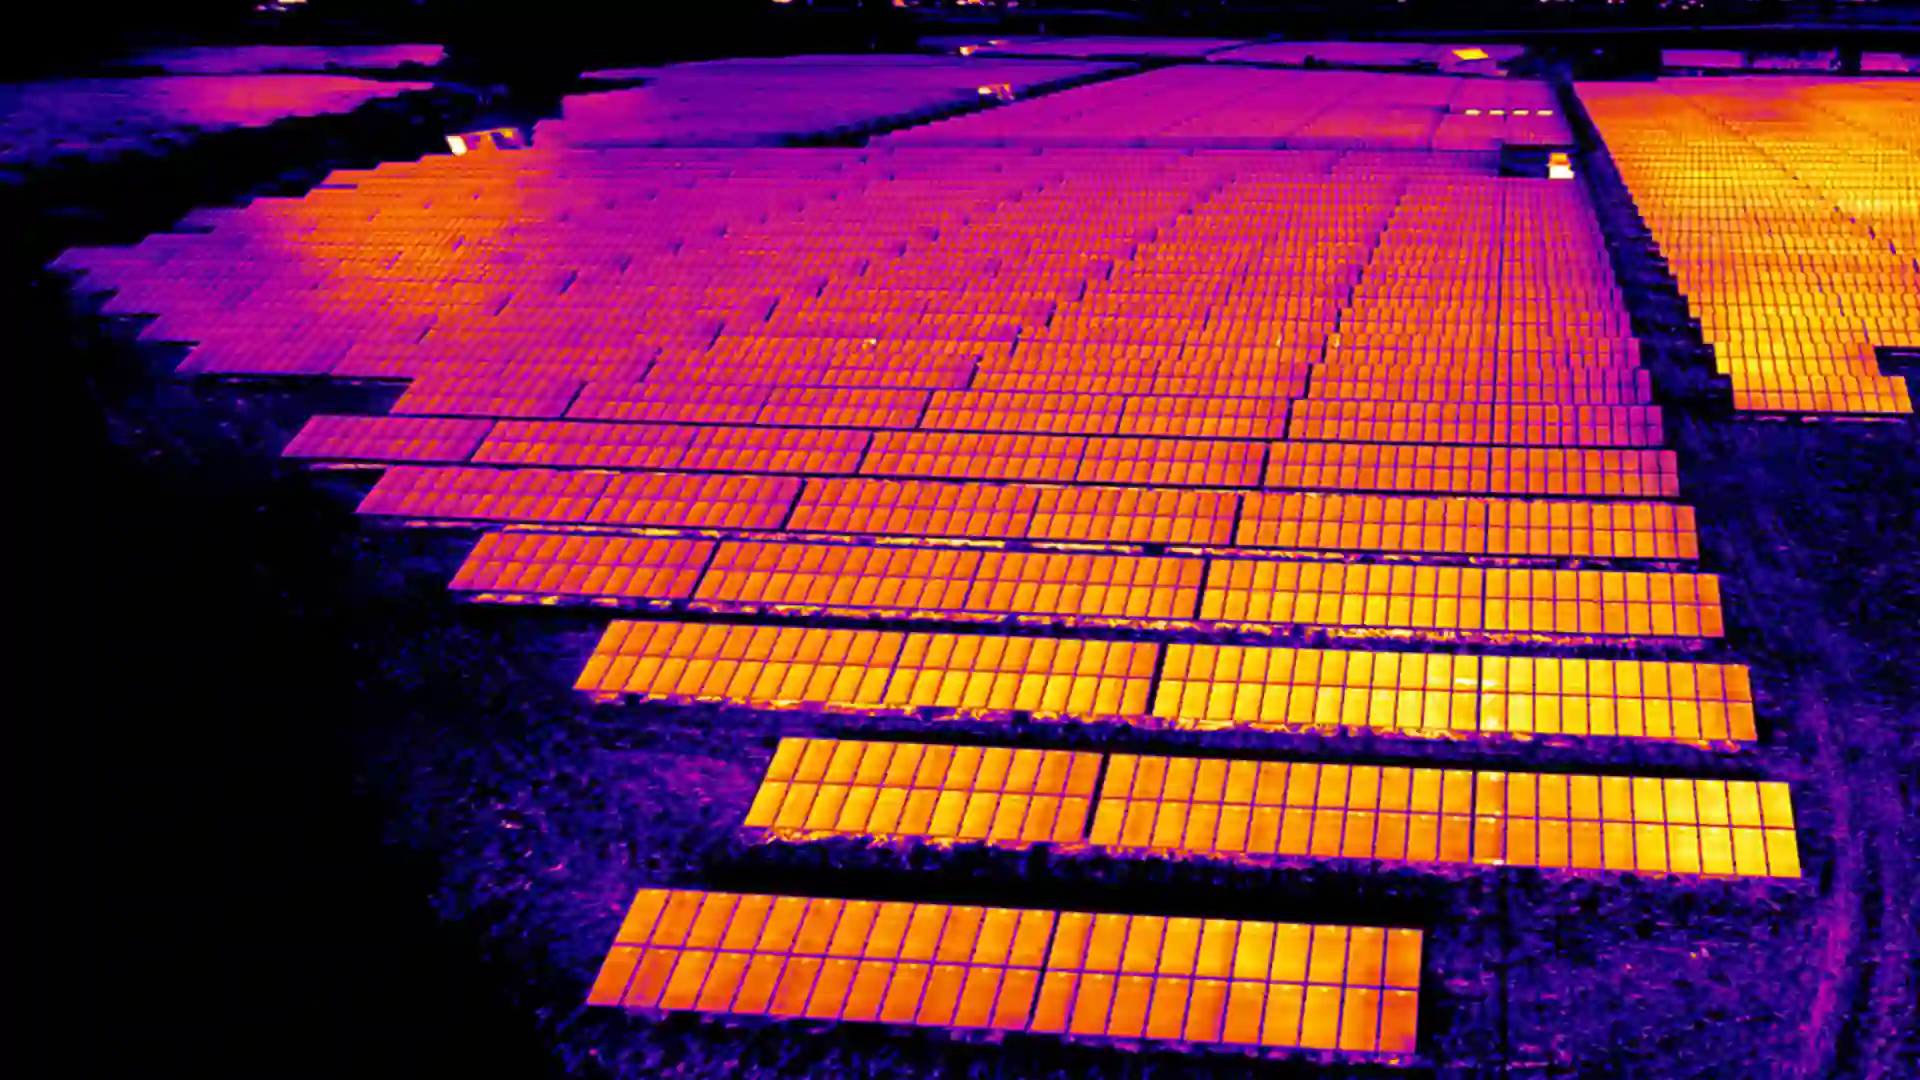
Thermal infrared view of asset
VISUAL THERMAL
Drag the slider left or right to compare

What it is

A thermal camera measures infrared radiation and converts it into a temperature map. Faults reveal themselves as temperature differences against a reference: a loose or corroded electrical connection runs hotter than an identical connection on the adjacent phase; a cracked photovoltaic cell or a failed bypass diode runs hotter than the modules around it; wet roof insulation holds heat longer than dry insulation and stays warm after sunset while the rest of the roof cools.

Two specifications matter, and they are often confused. Thermal sensitivity (NETD) on current radiometric drone payloads is in the range of 0.05°C, which is what allows small anomalies to stand out. Absolute accuracy is typically ±2°C or ±2% of reading. This is why credible thermography is comparative: an anomaly is identified by measuring a component against a similar component under similar load, not by trusting a single absolute number.

The value is lead time. A hot spot found at a substation becomes a scheduled repair with a parts order and a planned outage window. The same fault found after failure becomes an unplanned outage, an emergency crew and a much larger bill.

Precision in Every Flight

0.05

°C

Detect small temperature differences.

±2

°C / 2%

Reliable temperature measurement under controlled conditions.

1

Flight = 3

Thermal, RGB and LiDAR captured and co-registered.

3

Countries Served

Canada, United States and United Kingdom.

Engineered for High-Consequence Infrastructure.

Electrical Transmission & Distribution

Conductors, splices, insulators, switchgear, transformers, and substation connections. Flown with assets under load, since defective resistance only reveals heat when current is actively flowing.

Utility-Scale Solar Farms

Module and string-level defect detection across massive PV sites. Instantly flags cracked photovoltaic cells, localized hot spots, bypass diode failures, and completely offline strings.

Asset & Facility Inspection

Industrial chemical plants, exhaust stacks, process piping, refractory lining wear, storage tank levels, and high-speed mechanical bearings without shutdown or confined-space entry.

Building Envelope & Roofing

Heat loss, missing insulation, thermal bridging, and sub-membrane moisture intrusion in flat roofs and cladding. Flown after sunset when wet insulation retains thermal energy while dry roofs cool.

Emergency Response & Wildfire

Sub-surface hot spot mapping after structural or forest fires, post-event industrial disaster assessment, and rapid night-time search support through dense smoke and darkness.

Environmental & Agricultural

Water temperature monitoring, wildlife survey and vegetation stress across large areas.

How thermal supports an asset monitoring program

A visual inspection tells you what has already failed. Thermal tells you what is failing. A connection running above its neighbours, a corroding connector, an unbalanced load: these are visible days or weeks before the failure event.

A structured thermal program gives you:

01

Repeat surveys

The same assets flown on a fixed interval, so you track trend rather than a single snapshot. A connection that gains 8°C between surveys is a different problem than one that has been stable for two years.

02

Severity classification against a standard

Anomalies are ranked using delta T against a reference component, following recognized severity criteria such as NFPA 70B and ISO 18434-1, so your team knows what is immediate, what is a 30-day item and what is monitor-only.

03

Georeferenced anomalies

Every finding carries coordinates identifying the specific component, not a general area.

04

Load and weather context

Findings are recorded with ambient temperature, wind and load conditions at the time of capture, because a delta T without those conditions cannot be compared to anything.

05

A condition history

Successive surveys build a defensible record of asset condition across your network, useful for capital planning and for regulatory or insurance reporting.

Why Volatus

01

One flight, three datasets

Thermal, high-resolution RGB and lidar captured on the same mission and co-registered. You get the anomaly, the visual confirmation of what the component is, and its position in three dimensions.

02

Deliverables that go straight into a work order

Imagery, maps and structured data built around your findings, delivered in formats that fit how your team already manages assets.

03

Extended-coverage capability

For projects that call for coverage beyond standard visual-line-of-sight limits, Volatus has the regulatory experience and operational planning to scope and execute accordingly.

04

Drone and crewed aircraft under one roof

Where a project is better served by a crewed platform, Volatus delivers through Synergy Aviation, its in-house aviation company. You are not managing two vendors and two scopes.

05

Trained interpretation

Interpretation is the part of thermography that goes wrong. Our team follows industry best practices for thermal data collection and analysis, so findings hold up to scrutiny.

06

Canada, United States and United Kingdom

Volatus operates across all three, with the regulatory and operational experience for complex and remote industrial sites.

Discuss your program

Tell us the asset class, the scale, and what condition data you already have. We will tell you whether a thermal program fits your risk profile and outage windows, and say so if it does not.

Frequently Asked Questions

01What is thermal imaging?
Thermal imaging, or infrared thermography, uses heat-sensitive cameras to detect differences in surface temperature. Current radiometric drone payloads resolve differences on the order of 0.05°C. Developed originally for defence applications, thermography is now a standard condition-monitoring tool for electrical systems, machinery, solar installations and building fabric.
Every object above absolute zero (minus 273.15°C) emits infrared radiation, and the intensity rises with temperature. The camera detects that radiation and renders it as an image using a false-colour scale. Analysis then compares components against each other and against known severity criteria to separate normal operating heat from a developing fault.
Thermal cameras do not rely on visible light and work in full daylight or complete darkness. What matters is thermal contrast. For building envelope and roof moisture work, surveys are flown after sunset or in early morning, because daytime solar loading masks the signal you are looking for and because wet insulation shows its distinctive warm signature during the cooling period. For electrical and solar work, load conditions matter more than time of day.
Yes. Electrical faults are produced by current flowing through a defective connection, so they only appear under load. A survey flown on a de-energized or lightly loaded asset will under-report. We coordinate survey timing with your operations team to capture assets under meaningful load, ideally near peak.
Technically yes, and it frequently produces wrong answers. Accurate readings depend on correct emissivity and reflected apparent temperature settings, on distance and atmospheric compensation, and on capture geometry. A shiny busbar photographed at an oblique angle can read far hotter than it is, purely from reflection. The common outcomes are false positives that trigger unnecessary repairs and false negatives that miss real faults. Trained thermographers know the difference, and drone capture adds georeferencing so that findings can be located and re-flown.
No. Thermal cameras measure surface temperature only. That is a strength rather than a limitation: what you get is a measurement of what is actually happening at the surface, not an inference about what might be behind it.
Yes. A thermal camera is a passive instrument. It emits nothing and simply records infrared radiation that objects are already emitting. There is no risk to people, equipment or the environment.
As georeferenced imagery and structured findings, with coordinates, severity and supporting context for each anomaly, paired with visual imagery and lidar where captured. The output is organized so your team can move directly from data to work order.
It depends on asset criticality and your risk tolerance. Critical infrastructure such as high-voltage substations, data centres and solar farms is commonly surveyed quarterly or semi-annually so that degradation trends are visible. Building envelope surveys are typically annual, during heating season. We can help design an interval that balances budget, risk and outage windows.
Ground-based thermography gives close-range detail but is slow, and it requires personnel to access energized, elevated or otherwise hazardous positions. Drone thermal covers a full substation, a solar array or a line corridor in a fraction of the time and reaches positions a ground crew cannot safely occupy. The two are complementary: aerial survey identifies and prioritizes, ground inspection confirms where required.
Yes. Volatus operates in Canada, the United States and the United Kingdom, and can discuss partnership arrangements for projects in other jurisdictions.

Talk To An Expert

Talk To An Expert

Our experts are here to understand your needs and provide the right solutions for your mission.