
N

Photogrammetry

Overlapping images. Measurable ground truth.
It creates a measurable digital record of a site, structure, or corridor without putting survey crews across the entire area. A drone captures overlapping high-resolution images from a planned flight path. Processing converts those images into orthomosaics, point clouds, digital surface models, 2D maps, and 3D models. The resulting georeferenced data supports planning, surveying, construction and asset management.

What is Photogrammetry?

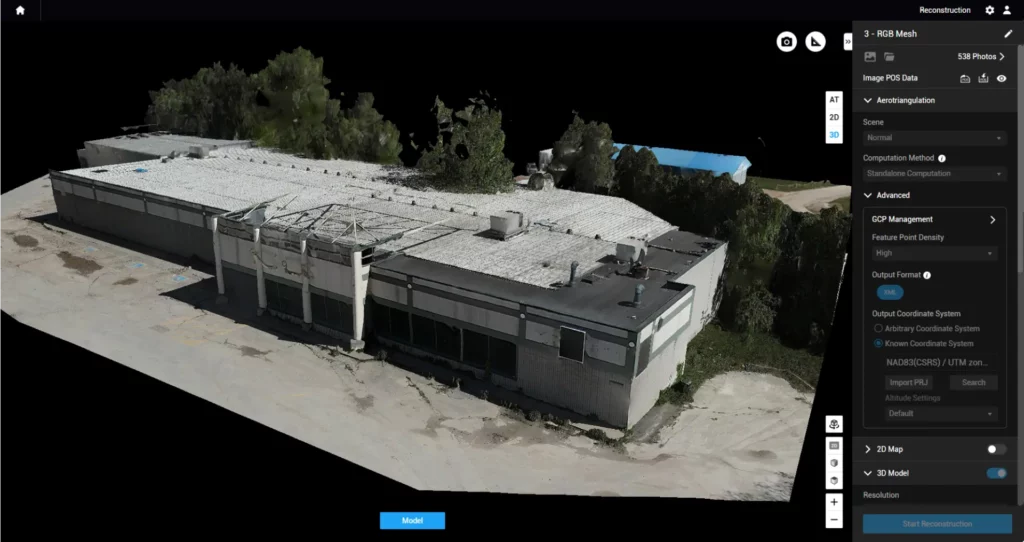
Photogrammetry uses overlapping aerial photographs to create accurate maps, measurements, and three-dimensional models of an area or object. It turns a series of images into spatial data that can be measured, analyzed, and used for surveying, planning, and asset management. Each image captures the subject from a different position.

Photogrammetry software identifies common points across the images and uses them to reconstruct the geometry of the subject. The result is an orthomosaic for mapping, a point cloud for measurement, a digital surface model for elevation analysis, or a 3D model for visualization and inspection.

RTK and PPK positioning provide accurate georeferencing for captured imagery, while ground control points can be added where additional survey control is required. The appropriate combination depends on the required accuracy and site conditions.
Industry Use Cases

Surveying and mapping

Topographic surveys, site mapping, corridor mapping, and aerial imagery for infrastructure and development projects.

Construction

Site surveys, progress tracking, earthwork measurement, as-built documentation, and 3D site models.

Mining and aggregates

Stockpile volumes, terrain models, site mapping and repeat surveys for tracking material movement.

Infrastructure

Roads, rail, utilities, pipelines, and other linear assets where large areas need to be mapped consistently.

Industrial sites

High-resolution mapping and 3D modeling of facilities, structures, and operational areas.

Environmental and forestry

Forest mapping, surface deposits, wetlands, logging roads and areas affected by development or disturbance.

How photogrammetry supports an asset monitoring program

A single survey tells you what a site looks like today. Repeat photogrammetry tells you what changed.

Asset Monitoring — Repeat Survey Analysis (Elementor Dynamic Height Widget)

Repeat Survey Analysis

BASELINE FILL CUT
Active Survey
E01 (Ref)
Δ Fill
+0 m³
Δ Cut
−0 m³
Net Volume
0 m³
E01 · BASELINE ESTABLISHED 2026-03-08 · Initial reference datum

01

Repeat surveys

The same site can be captured at fixed intervals, creating a consistent record of construction progress, terrain change, stockpile movement, or asset condition.

02

Georeferenced mapping

Every image and derived dataset is tied to its geographic position, allowing measurements and findings to be located precisely.

03

2D and 3D data

One capture produces multiple outputs, from orthomosaics and elevation models to point clouds and 3D models.

04

Volumetric measurements

Surface models allow stockpile and material volumes to be calculated, and changes between surveys are to be tracked.

05

Change detection

Repeat datasets can be compared to identifying where terrain, structures, or site conditions have changed.

Why Volatus

01

Integrated lidar capability

Volatus drones are equipped with lidar can be added to provide dense three-dimensional data where vegetation, terrain or structural complexity limits photogrammetry.

02

Professional processing

Volatus supports photogrammetry workflows using platforms including Pix4D and DJI Terra for processing imagery into maps, point clouds and 3D models.

03

Aerial and terrestrial capability

Volatus combines aerial acquisition with terrestrial geomatics capabilities, allowing the survey method to match the site and required deliverable.

04

Extended coverage capability

For projects that call for operations beyond standard visual-line-of-sight limits, Volatus has the regulatory experience and operational planning to scope and execute accordingly.

05

RTK and PPK positioning

High-accuracy positioning supports georeferenced aerial data and repeatable mapping workflows.

Discuss your program

Tell us the site, the scale, and what mapping data already exists. We will recommend the right photogrammetry approach, including the aircraft, sensors, positioning and deliverables required, and say so if photogrammetry is not the right fit.

Frequently Asked Questions

01What is photogrammetry?
Photogrammetry uses overlapping photographs to create maps, measurements, and 3D models. Drone photogrammetry captures those images from the air, allowing large sites and difficult-to-access areas to be mapped efficiently.
The drone captures overlapping images along a planned flight path. Photogrammetry software identifies common points between images and reconstructs the surveyed area in three dimensions. The resulting data can be processed into orthomosaics, point clouds, surface models, and 3D models.
Depending on the project, outputs include orthomosaics, photogrammetric point clouds, digital surface models, 2D maps, 3D models, and volumetric calculations.
Accuracy depends on the aircraft, camera, positioning system, ground control, flight planning, and processing workflow. Volatus uses RTK and PPK positioning as part of its high-accuracy mapping workflows. Survey methodology is selected around project requirements rather than applying one accuracy figure to every survey.
RTK and PPK are positioning technologies used to improve the geographic accuracy of drone data. They allow aerial imagery to be accurately positioned during or after the flight, reducing reliance on extensive ground control depending on project requirements.
Not always. RTK/PPK positioning can provide accurate georeferencing, while ground control points can be added when additional survey control is required. The appropriate approach depends on the required accuracy and site conditions.
An orthomosaic is a single map created by combining multiple aerial photographs and correcting them for perspective and terrain. Unlike a conventional aerial photograph, it can be used as a measurable geographic reference.
Yes. Overlapping aerial images can be processed into three-dimensional point clouds and models. These models provide a digital representation of terrain, structures, and project sites.
Yes. Photogrammetric surface models can be used to calculate stockpile and material volumes. Repeat surveys can also show how those volumes change over time.
Yes. Repeat drone surveys create comparable maps and models of a construction site. They can document progress, compare conditions, and maintain a visual record throughout the project.
Photogrammetry builds 2D and 3D information from imagery. LiDAR uses laser measurements to create dense three-dimensional point clouds. Photogrammetry is effective for visual mapping and modelling; LiDAR provides additional terrain and structural information, particularly where vegetation or complex surfaces make image-based mapping less effective.
Yes. Volatus can combine RGB photogrammetry and LiDAR when a project requires both visual imagery and detailed three-dimensional data. This provides a more complete dataset from the same aerial operation.

Talk To An Expert

Talk To An Expert

Our experts are here to understand your needs and provide the right solutions for your mission.