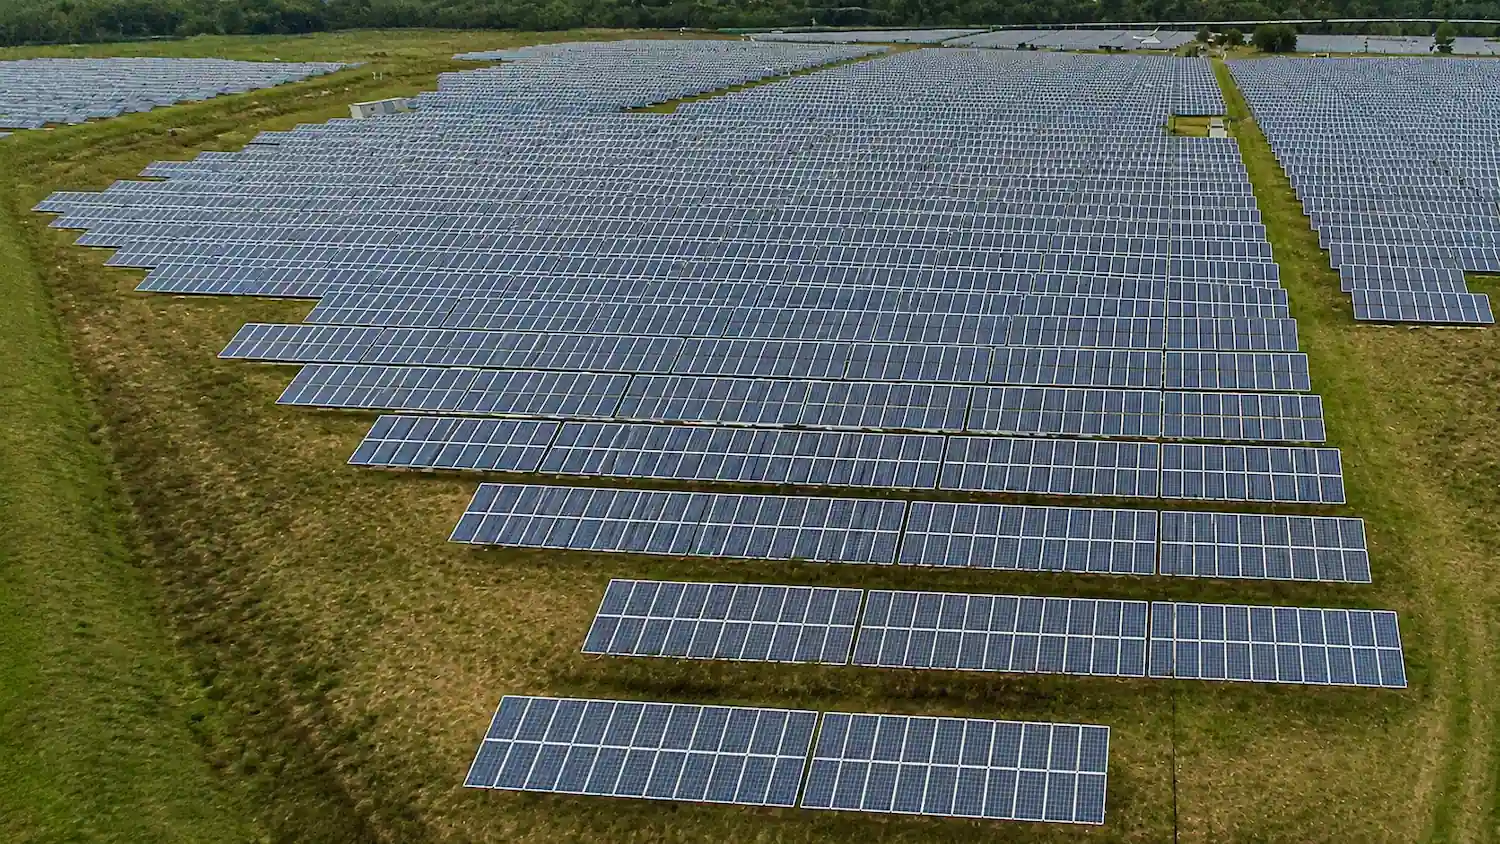
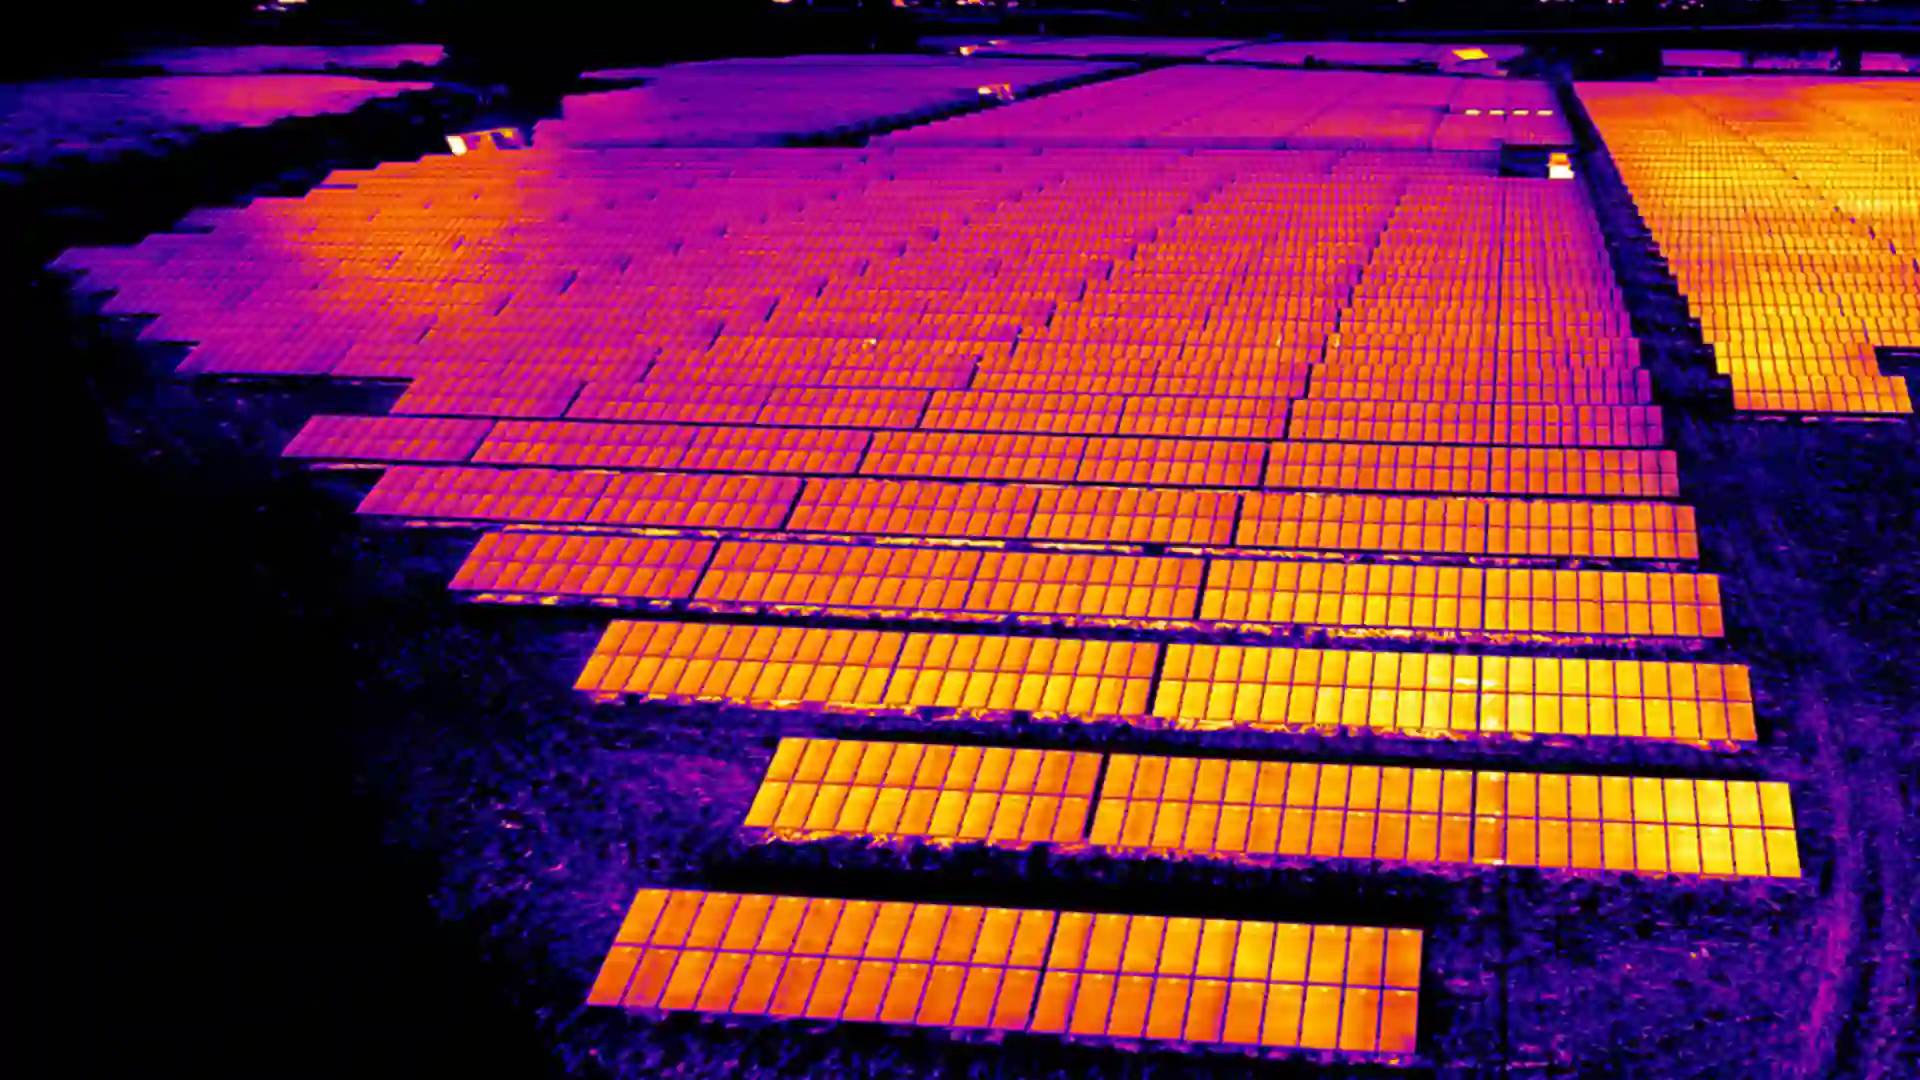
A thermal camera measures infrared radiation and converts it into a temperature map. Faults reveal themselves as temperature differences against a reference: a loose or corroded electrical connection runs hotter than an identical connection on the adjacent phase; a cracked photovoltaic cell or a failed bypass diode runs hotter than the modules around it; wet roof insulation holds heat longer than dry insulation and stays warm after sunset while the rest of the roof cools.
Two specifications matter, and they are often confused. Thermal sensitivity (NETD) on current radiometric drone payloads is in the range of 0.05°C, which is what allows small anomalies to stand out. Absolute accuracy is typically ±2°C or ±2% of reading. This is why credible thermography is comparative: an anomaly is identified by measuring a component against a similar component under similar load, not by trusting a single absolute number.
The value is lead time. A hot spot found at a substation becomes a scheduled repair with a parts order and a planned outage window. The same fault found after failure becomes an unplanned outage, an emergency crew and a much larger bill.
A visual inspection tells you what has already failed. Thermal tells you what is failing. A connection running above its neighbours, a corroding connector, an unbalanced load: these are visible days or weeks before the failure event.
A structured thermal program gives you:
The same assets flown on a fixed interval, so you track trend rather than a single snapshot. A connection that gains 8°C between surveys is a different problem than one that has been stable for two years.
Anomalies are ranked using delta T against a reference component, following recognized severity criteria such as NFPA 70B and ISO 18434-1, so your team knows what is immediate, what is a 30-day item and what is monitor-only.
Every finding carries coordinates identifying the specific component, not a general area.
Findings are recorded with ambient temperature, wind and load conditions at the time of capture, because a delta T without those conditions cannot be compared to anything.
Successive surveys build a defensible record of asset condition across your network, useful for capital planning and for regulatory or insurance reporting.
Thermal, high-resolution RGB and lidar captured on the same mission and co-registered. You get the anomaly, the visual confirmation of what the component is, and its position in three dimensions.
Imagery, maps and structured data built around your findings, delivered in formats that fit how your team already manages assets.
For projects that call for coverage beyond standard visual-line-of-sight limits, Volatus has the regulatory experience and operational planning to scope and execute accordingly.
Where a project is better served by a crewed platform, Volatus delivers through Synergy Aviation, its in-house aviation company. You are not managing two vendors and two scopes.
Interpretation is the part of thermography that goes wrong. Our team follows industry best practices for thermal data collection and analysis, so findings hold up to scrutiny.
Volatus operates across all three, with the regulatory and operational experience for complex and remote industrial sites.
Tell us the asset class, the scale, and what condition data you already have. We will tell you whether a thermal program fits your risk profile and outage windows, and say so if it does not.